Calculating bias in COBRA using Solver of MS Excel:COBRA is a very useful relatively simple method to determine the degree of methylation of a given segment of genomic DNA. A potential problem with this method is that PCR will amplify the bisulfite treated DNA with a efficiency that depends on the GC contents, i.e. the degree of the initial methylation. Basically, weakly methylated DNA molecules will be amplified more efficiently than highly methylated DNA molecules, creating a bias in your data. This problem can be resolved by determining a bias correction value b, and using it to calculate the true methylation based on your COBRA results: 1) create defined mixtures of M.SssI methylated and unmethylated template, run bisulfite PCR, run COBRA. We use the example of a MboI (GATC) digested PCR product, with one restriction site. If the DNA is not methylated, no digestion occurs (left), if the DNA was fully methylated, all the PCR product should be digested (right). In the example a small remaining undigested band is visible, indicating that either methylation or digestion is not complete. 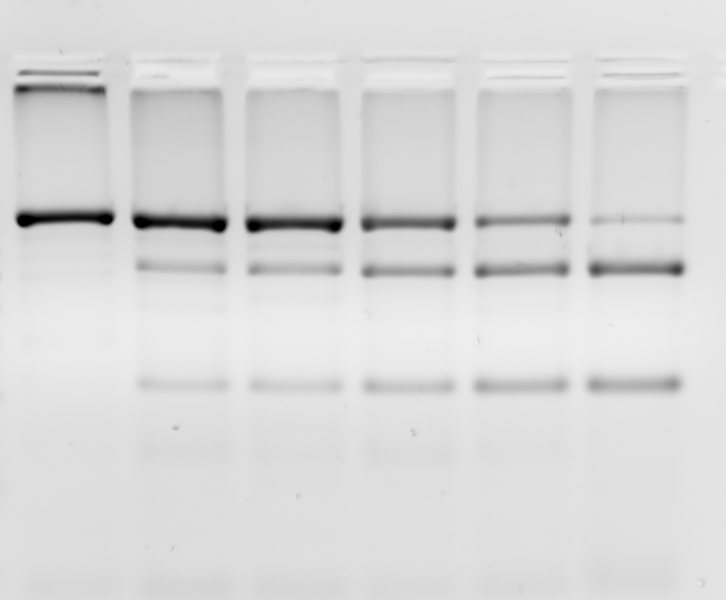
2) Image analysis: Quantify the band intensities and calculate relative band intensities of the undigested band. Type this as % into an Excel worksheet: 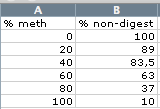
3) Calculate % digest (100 - % nob-digest): 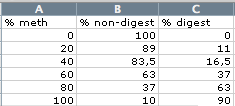
4) create a column with % digest to fit according to the following model (Warnecke 1997): y = (100bx)/(bx – x + 100) with x = % methylation, y = % digest, b = bias. Use a separate cell for b (in our example E9): 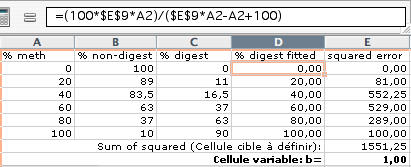
5) Calculate squared error and sum of squared error: 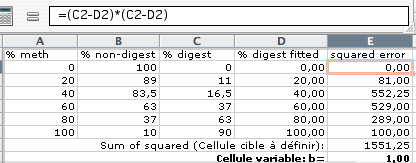
6) Use the Solver (Tools... Solver...) of Excel to fit the values in column “% digest fitted”: 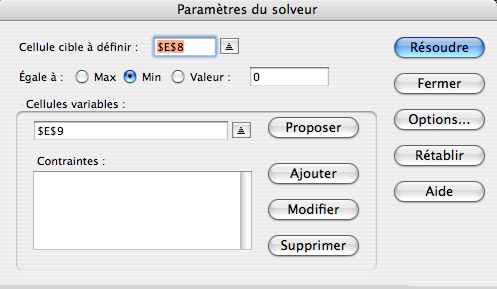
(english version: “Set target cell: $E$8” and “By changing Cells: $E$9). Solver will minimize the sum of squared errors by iteration and find the optimal bias value b (here 0.39): 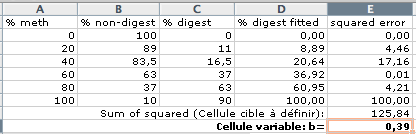
8) Calculate R 2 as quantifier of goodness of fit: Add a new column that contains the square of the distance of each % digest to the average of % digest: 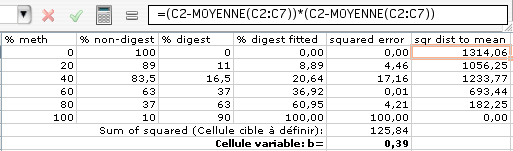
R2 is defined as 1-(sum of the square of distances to mean / sum of squared distances to fit) http://www.graphpad.com/curvefit/goodness_of_fit.htm . 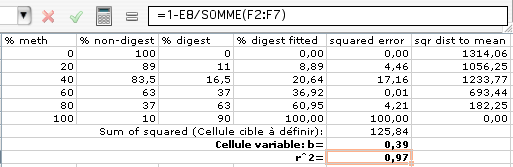
9) The bias value b can now be used to calculate the true methylation of a sample from the COBRA result. In our example, a sample that shows 80% digestion (20% undigested) comes from DNA that has methylation of 91% in the restriction site. 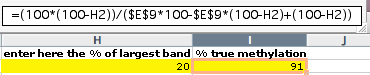
Warnecke et al., Detection and measurement of PCR bias in quantitative methylation analysis of bisulphite-treated DNA. Nucleic Acids Res. 1997 Nov 1;25(21):4422-6. [PubMed] John, Simplified Curve Fitting using Spreadsheet Add-ins. Int. J. Engng Ed. 1998 14(5):375-80. |